

Manchester City
Manchester City
Wyscout Reports - What do they tell us about Pressing?

Here’s a team report from Wyscout, and while they don’t use the Statsbomb data we’ve been focusing on, they do use another metric used to measure pressing - and indeed one of, if not, the first used to look at teams who apply more defensive pressure than most; especially in a sustained manner.
Manchester City - Wyscout Report
Here’s the image of MCFC using the 4-3-3 formation:

Now, unfortunately, there’s a problem with this image - because unless you are aware that lower means better for PPDA then you’d think they are struggling with their pressing numbers. The opposite is true - 7.92, in the context of the league, is usually around the top three.
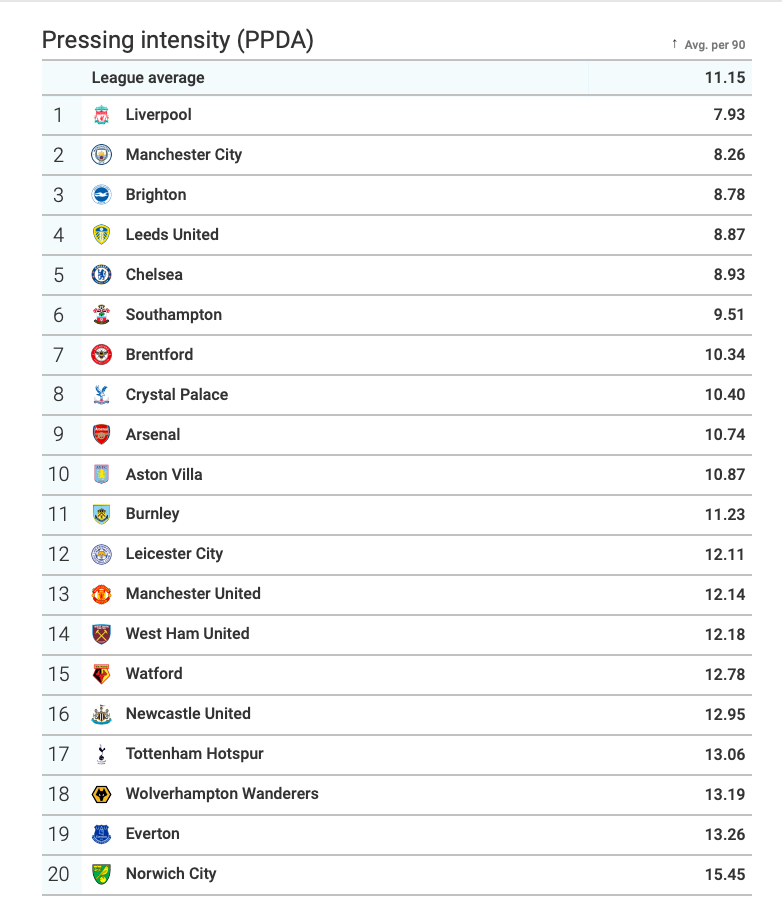
As you can see below - and something that corresponds with the data used by Statsbomb - Liverpool press the most followed by Man City, and this figure of 7.92 indicates elite level PPDA (passes per defensive action).
Conclusion:
Well if Wyscout’s own reports can’t use visual representation correctly then you have to be concerned about how the report other data. The 10.29 xG for using the 4-3-3 is clear for all to see, but it looks to the naked eye like the opposition are dominating them based on PPDA!
Further Watching:
It is key for any off-the-ball analysis to use video footage to supplement any conclusions. This is really good looking at Man City vs Chelsea last season. In Premier League, it is often the matches between the so-called top six who both try and press high that create the best matches to watch.